Objective: With this experiment, we try to simulate the warming effect of greenhouse gases in our atmosphere using a plastic bottle, water vapor, and carbon dioxide.
Procedure: We placed a temperature probe in a 2 L bottle and exposed it to either a lamp or sunlight for 10 minutes, before moving it out of the light for another 5 minutes. This procedure was done for three scenarios: (1) when the bottle was empty, (2) when the bottle contained 200 mL of water, and (3) when the bottle contained 200 mL of water and carbon dioxide from an effervescent antacid (such as Alka-Seltzer).
Procedure: We placed a temperature probe in a 2 L bottle and exposed it to either a lamp or sunlight for 10 minutes, before moving it out of the light for another 5 minutes. This procedure was done for three scenarios: (1) when the bottle was empty, (2) when the bottle contained 200 mL of water, and (3) when the bottle contained 200 mL of water and carbon dioxide from an effervescent antacid (such as Alka-Seltzer).
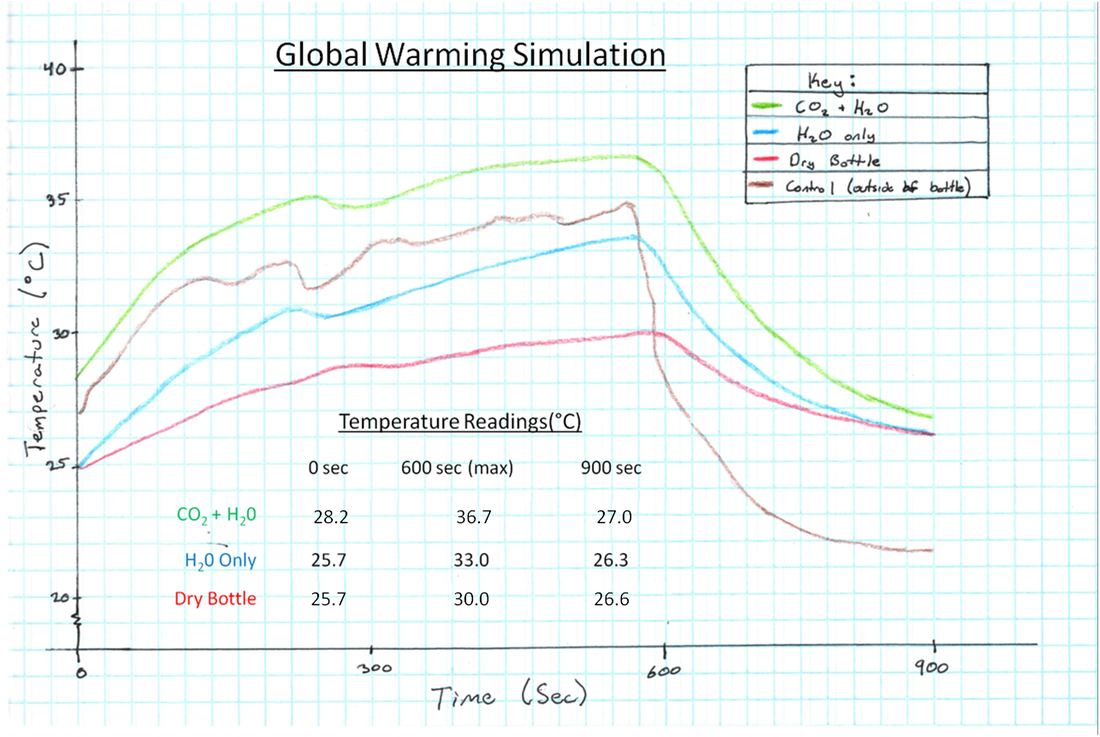
Data (Compiled):
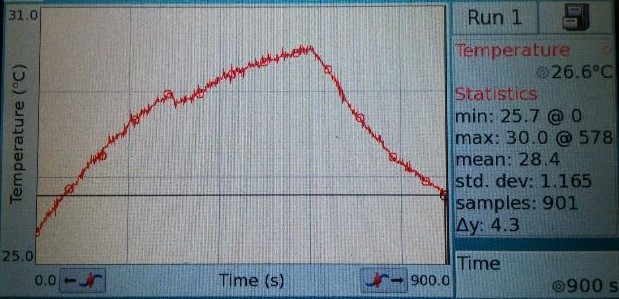
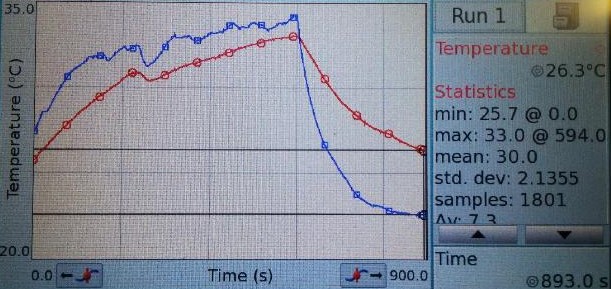
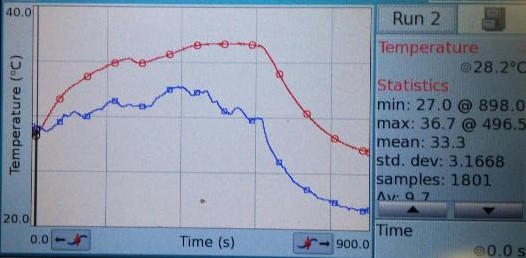
Data (Raw):
Questions:
1. Describe the general characteristics of each of the graphs.
1. Describe the general characteristics of each of the graphs.
- The graph for the controls, where the temperature probe was outside the bottle, was erratic and seemed to react quicker and greater to minor variations than the other scenarios. When the time reached 10 minutes and the probe was moved out of the light, the graph fell rapidly, at the greatest rate of any of the scenarios.
- The graph for Scenario 1 exhibited a similar erratic characteristic, though it held to a general warming trend better than the control. At 10 minutes, the graph fell as well, though at a much slower pace than the control.
- The graph for Scenario 2 lacked the erratic characteristic, presumably because of the insulating effect of water vapor. At 10 minutes, the graph fell, though again at a slower pace than the control.
- The graph for Scenario 3 similarly lacked the erratic characteristic of the control and Scenario 1. At 10 minutes, the graph fell at a similar rate as Scenarios 1 and 2. This Scenario presented the highest temperatures of all four recordings.
- Scenario 3 saw the greatest temperature change with a change of +8.5 degrees Celsius compared to +4.3, +7.3, and +7.8 for Scenario 1, Scenario 2, and the control, respectively. The positive association between the "atmospheric" density and the temperature change can be attributed to the greater greenhouse effect of the water vapor and then the water vapor and carbon dioxide. The higher temperature change of the control as opposed to Scenarios 1 and 2 can be attributed to the insulating effect of the bottle and "atmosphere."
- There seemed to be two trends: (1) a negative association between the maximum temperatures and the rate at which the bottles cooled and (2) a clear difference between the bottled readings and the exposed readings with the exposed readings having a higher rate of cooling.
- The four major greenhouse gases are water vapor, carbon dioxide, methane, and nitrous oxide. Carbon dioxide is considered the most important because it is primarily produced through artificial means and anthropogenic emissions of CO2 are so high in volume (it represents 82% of global emissions). Thus, even though carbon dioxide has less warming potential than methane or nitrous oxide, it has the largest absolute effect.
- Global warming is any general trend of warming of the Earth's atmosphere. The greenhouse effect is a specific climate mechanism. Greenhouse gases (like carbon dioxide or methane) allow (rather than reflect) the short wavelength ultraviolet radiation from the Sun into the atmosphere. Once inside the Earth's system, this radiation is absorbed by either the surface of the Earth or the atmosphere itself. Once it is absorbed, it can be emitted primarily as heat, or infrared radiation. This radiation, which has a longer wavelength than UV radiation, is reflected more in the atmosphere's greenhouse gasses, trapping it and its energy inside Earth's system. This trapped energy acts as a sort of homeostatic mechanism to maintain the Earth's temperature. However, when there is an overabundance of greenhouse gases (like today) the average temperature can increase, causing global warming. Thus, global warming is not the greenhouse effect, but the greenhouse effect, when not moderated, can cause global warming.
- Venus has an extremely thick atmosphere (90 times thicker than ours) made up primarily of carbon dioxide with an additional thick layer of sulfur dioxide clouds on top of the carbon dioxide. This creates the solar system's strongest greenhouse gas effect and the hottest surface temperatures despite receiving 75% less solar radiation than Mercury. On the converse, Mercury has no long-term atmosphere (though it does have an extremely thin exosphere), preventing the retaining of much heat like in Venus' case. Thus, even though Mercury receives more solar radiation by far, it's maximum surface temperature is still 40 Kelvin lower than Venus' minimum.
- The First Industrial Revolution, or specifically the invention of the modern steam engine, resulted in the burning of unprecedented amounts of wood, coal, petroleum, natural gas, etc. in order to fuel the industrial growth of the world. The resulting emissions were similarly unprecedented, causing today's phenomenon of global warming.
- The 10 hottest years on record are, in order from hottest to coldest,
- 2014, 2010, 2005, 1998, 2013, 2003, 2002, 2006, 2009, and 2007. Should this trend continue, we can expect any number of impacts.
- We can expect increased frequency and intensity of extreme weather events like droughts, heat waves, hurricanes, and cold fronts. This would affect places already susceptible to these problems like the American Southwest, the American Gulf Coast, and South-Southeast Asia.
- We can expect rises in sea levels as polar and glacial ice melts. This would severely impact low-lying areas including American cities like New York City, Miami, and New Orleans; highly-developed European regions like Southeast England, the Low Countries, and the Po River Valley; as well as lesser-developed yet still highly-populated regions like the Niger River Delta, Bangladesh, and coastal Southeast Asia.
- We can expect an increase in the spread of disease as higher temperatures and new refugee crises create some of the most perfect breeding grounds for tropical diseases like Malaria.
- We can expect substantial decreases in biodiversity as widespread climate change alters habitats faster than animals can naturally adapt. This will destroy food webs, hamper agriculture, and prevent most new advancements in medicine and biotechnology that rely on biologically-dense habitats like rain forests and coral reefs.
- Potentially worst of all, we can expect the possible confirmation of the "clathrate gun hypothesis" in which the rising sea temperatures and increased frequencies of Arctic storms can cause the release of methane clathrate, or methane hydrate, currently trapped in subsea permafrost. Such a release would create a runaway positive feedback loop that cannot be stopped by simply reducing carbon dioxide emissions. Such as a feedback loop is believed to have occurred in the past, causing the extinction of 95% of marine species 252 million years in the Permian-Triassic Extinction Event.
- Definitely worst of all, however, is the personal impact to me. The prolonging of heat waves and the drought in the American Southwest will have a tremendous detriment to the economy of California and the supply of food in America. Rising sea levels threaten the San Francisco Bay Area and California Delta that are both some important to California. Ultimately though, the rising temperatures will simply make California even more uncomfortable for me to live in, forcing me to move away.


 RSS Feed
